


MYCORRHIZAL ASSOCIATIONS: The Web Resource
Section 11. RESOURCES
A. Diagrams
Links to downloadable files are provided below. These include diagrams introducing mycorrhizal associations and explaining methodology in Adobe Acrobat PDF format. These images can be viewed or saved on your computer and printed to make overheads or slides (you need Adobe Acrobat Reader). Please note that all images on this site are protected by copyright and cannot be used in other publications without written permission. These are a selection of the diagrams and photographs from the book Working with Mycorrhizas in Forestry and Agriculture.
1. Methodology Diagrams
 |
 |
Figure 1.1.Mycorrhizal Interactions Diagram. |
Figure 1.2. Root Systems. |
 |
 |
 |
Figure 1.4. Components of ECM Associations. |
Figure 1.5. Looking at ECM associations. |
Figure 1.8. Looking at VAM associations. |
 |
 |
 |
Figure 1.9. Components of VAM associations. |
Figure 1.13. Compound and dissecting microscopes. |
Figure 2.2. Collecting ECM fungi for herbarium specimens. |
 |
 |
 |
Figure 3.1. Looking at spores of Glomeromycotan fungi. |
Figure 3.7. Morphotypes of VAM fungi in roots. |
Figure 3.9. Separating spores of VAM fungi from soil |
 |
 |
Figure 3.15. Comparing methods for isolating Glomeromycotan fungi (data from Brundrett et al. 1999). |
Figure 3.14. Sampling pot cultures of VAM fungi. |
 |
 |
 |
Figure 4.3. Gridline intersection method of VAM quantification. |
Figure 4.4. Making microscope slides of stained roots. |
Figure 4.5. Gridline intersection method of ECM quantification. |
 |
 |
 |
Figure 4.8. Soil coring to measure mycorrhizal inoculum by bioassay. |
Figure 4.10. Hand sectioning mycorrhizal roots. |
Figure 5.5. ECM fungus isolation into sterile culture. |
 |
 |
Figure 6.2. Assessing mycorrhizal requirements in disturbed habitats. |
Figure 6.4. Soil P depletion zones around VAM and NM roots. |
2. Other Diagrams
 |
 |
Figure in Section 1. Symbiotic associations diagram (after Brundrett 2004). |
Figure in Section 1. Mycorrhizal categories and morphotypes (after Brundrett 2004). |
B. Larger Photographic Images
I. Arbuscules
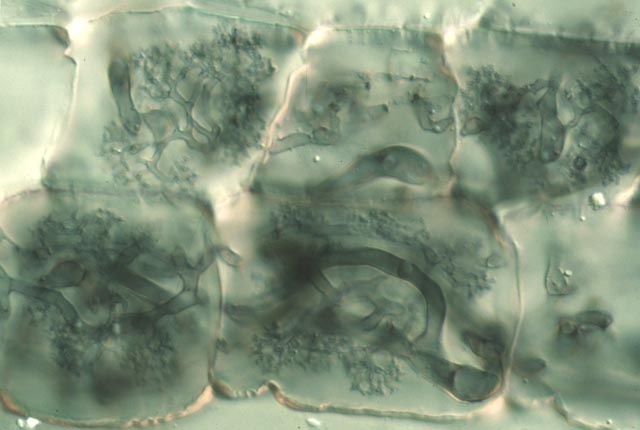 |
Arbuscule in Erythronium americanum a host with a coiling VAM association. |
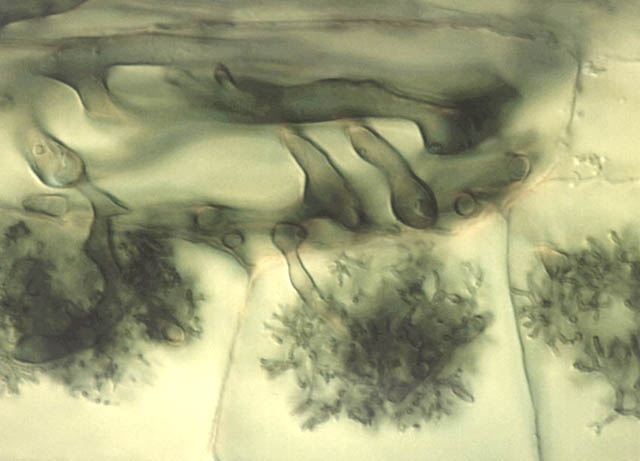 |
Arbuscule in Asarum canadense a host with a coils and arbuscules in the inner cortex only. |
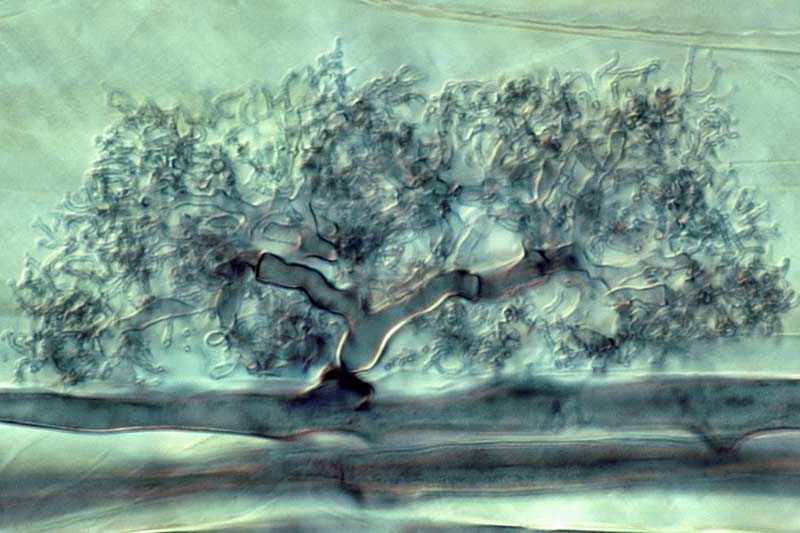 |
Highly magnified view of a Glomus Arbuscule. |
II. Ectomycorrhizas
 |
Hartig net of Populus |
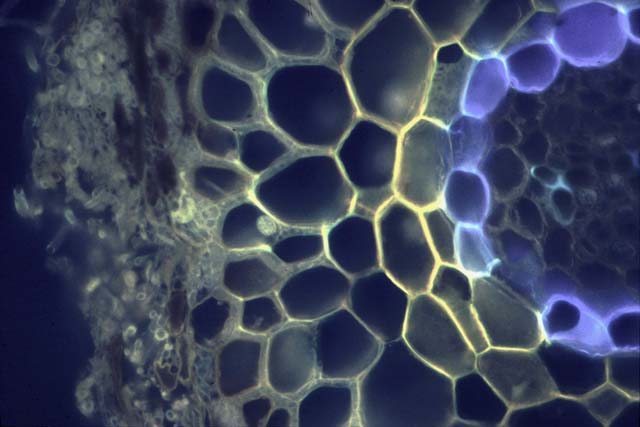 |
Unstained cross section of ECM of Larix laricina showing UV-induced autofluorescence of hyphae and root cells. |
III. Root Anatomy
 |
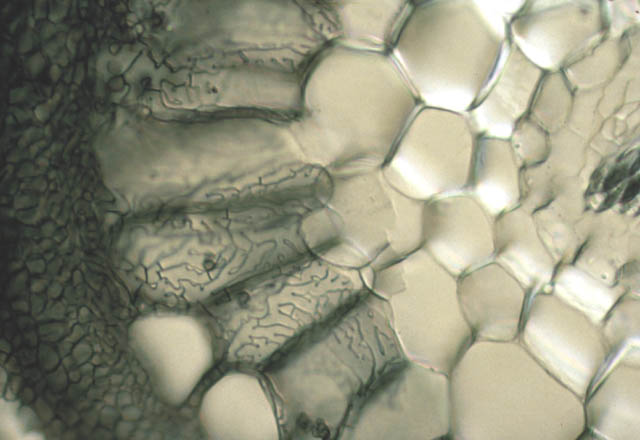
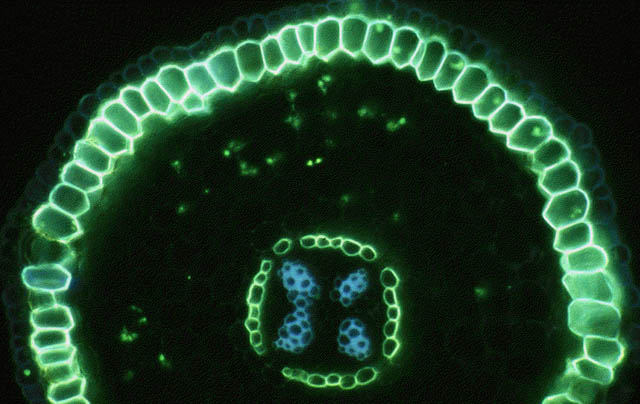
Cross section of an onion (Allium cepa) root showing modified cell walls of exodermal and epidermal cells. Hand section with a fluorescent stain for suberin (Berberine). |
 |
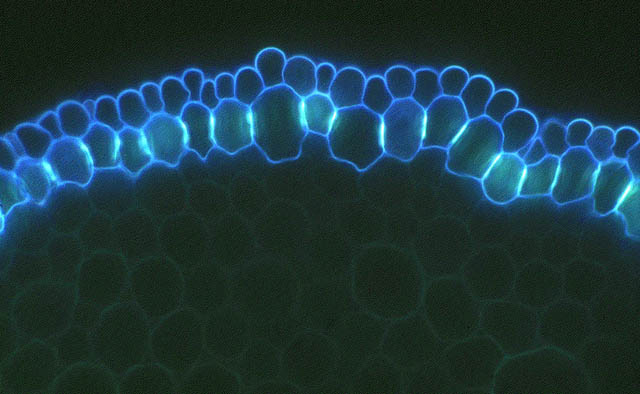
Close-up of the outer cell layers of an ash tree (Fraxinus) root showing suberin lamellae in exodermal cells. Hand section with a fluorescent stain for lipids (Fluorol). |
Version 2 © Mark Brundrett - 2008